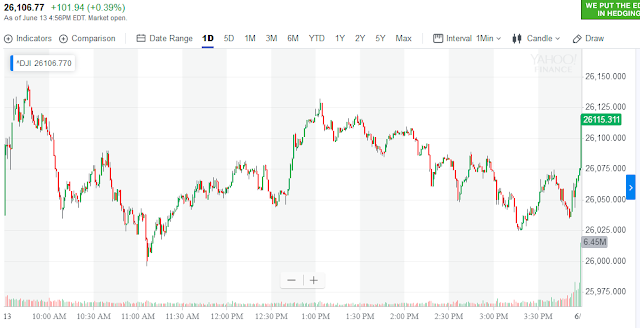
Update: Something that I just noticed. On the first chart, the bullhead actually begins at exactly 10:00 AM. It ends at exactly 10:52 AM. Could this mean that the top will be on July 1? Hell yes it does. I think it will be on 7/1 OR 7/8. They both work fine. The 7/1 top makes sense from the standpoint of a False Flag (like I showed you on the 2018 June July Chart) or other bad news happening over the July 4th weekend.
The number one reason that people laugh off what I am telling them is getting ready to happen, is their past, and the past of being programmed and brainnwashed to think America is the King Country and that we will always be safe here, and that all of our everyday expectations and conveniences will always be here. One example:
The reason that they have always shown us "crazy people" that "predict" the apocalypse, over and over, year after year is just to condition you to not believe the few people who can actually see it, when it is near...like me. Folks, all of the stories that you have ever heard about 9/23 or any number or any person predicting doom and gloom....they are all fake just like all the fake shootings. Do not believe me and you will reap the results.
I promise you that the only denial that you will have left, after the bullhead finishes, after the top is in in early July, and when you see the market crashing in late July and August...the only denial left for anyone following me will be a "no logic denial". You will have no argument left. I will be finished on here some time in July as there will be no need. My needs will be elsewhere.
Another example: Nearly every single time, without exception (especially the men) when I begin to tell people what is just a short time away I always hear...I have been hearing that for years, they have been predicting the apocalypse for years. And here is what I hear the most without fail: Y2K (Y2K IS THE SINGLE BIGGEST DENIAL REASON THAT I HEAR AND ALWAYS HAS BEEN FOR THE LAST FEW YEARS). Folks, this is exactly what they planned. Y2K was planned to happen, and planned to scare you, and then planned to make you "feel safe" after it passed with no problems. They scared everyone into preparing for something "they they (not me, you see the difference) told you and warned you to prepare for" then it was not needed...so the outcome is that now people think doomsday scenarios (especially those predicted by regular folks like me) will never happened. You prepared for Y2K like a good government slave, cause THEY TOLD YOU TO, then it was not needed so now you feel safe cause THEY ARE NOT TELLING YOU HELL IS COMING, a crazy redneck conspiracy theorist is. It is very sad that intelligent (supposedly) people can not see this.
THIS IS THE REASON FOR MY FRUSTRATION. The person that you should be listening to, a friend, a loved one, a family member (especially when they have given their entire life over the past few years to warn you) you just cast aside, but the news...or the government...you just lap their bullshit up. Folks, what I have been telling you for years, is that your own government, in collusion with other governments are the very ones getting ready to kill you...and you expect them to warn you about it first...with a date to boot. Come on folks...you have been brainwashed.
I have proven without a doubt that the stock market is manipulated everyday. The open, close, high and low and all of the in between are planned for years before. I have shown you just over the last few months that they draw large daily chart letters and patterns, and that they also hide these before hand in the intra day charts...just like this current bullhead. If it is not obvious by now that the current pattern is a bullhead...there is no hope for you. And I have shown you several intra-day charts that show the bullhead, but yesterday there was one more good one. Below is the intra-day chart yesterday showing a near perfect bullhead, and the second graphic is the daily chart showing you the current bullhead in progress now. The Intra-Day bullhead began around 10 AM and ended around 11 AM.
On the second graphic the top line is 27,335. The left most line is 6/24 (when I thought the bullhead might end, but I think it will be a few days earlier.) At this time, I think it will end sometime next week and then began the upward move to the final top. The right most line is July 8, when I think the market will top. It will top out and begin to crash sometime between 7/1 and 7/15. The top will either be on 7/1 or 7/8 in my opinion, and will then begin to crash within the following week.
 |
| 6/12/2019 Intra-Day Chart Showing Bullhead Early In Session |
 |
| DJIA Daily Chart 6/12/2019 Showing Bullhead In Progress |


